The FORCeS eScience course “Tools in Climate Science: Linking Observations with Modelling” was held at the Tjärnö Marine Biological Laboratory, Sweden, from November 1st to November 8th.
The course introduced the role of aerosols and clouds in Earth’s climate system along with observational techniques, Earth system models, climate forcing and climate model evaluation through a series of lectures and tutorials.
We made an extensive use of Galaxy Pangeo Climate JupyterLab interactive tool for modern visualization, data analysis and statistical tools. Each participant work on a scientific project and at the end of November (22/23 November) will deliver a final Jupyter Notebook and give an oral presentation to show their main achievements and results.
Setup and data availability
The figure below shows what was available to end-users. The dashed lines (blue and magenta) represent data access points that are all external to your Galaxy instance. In fact, there are many more access points where you can get access to data and we only listed the ones that may be relevant for this course.
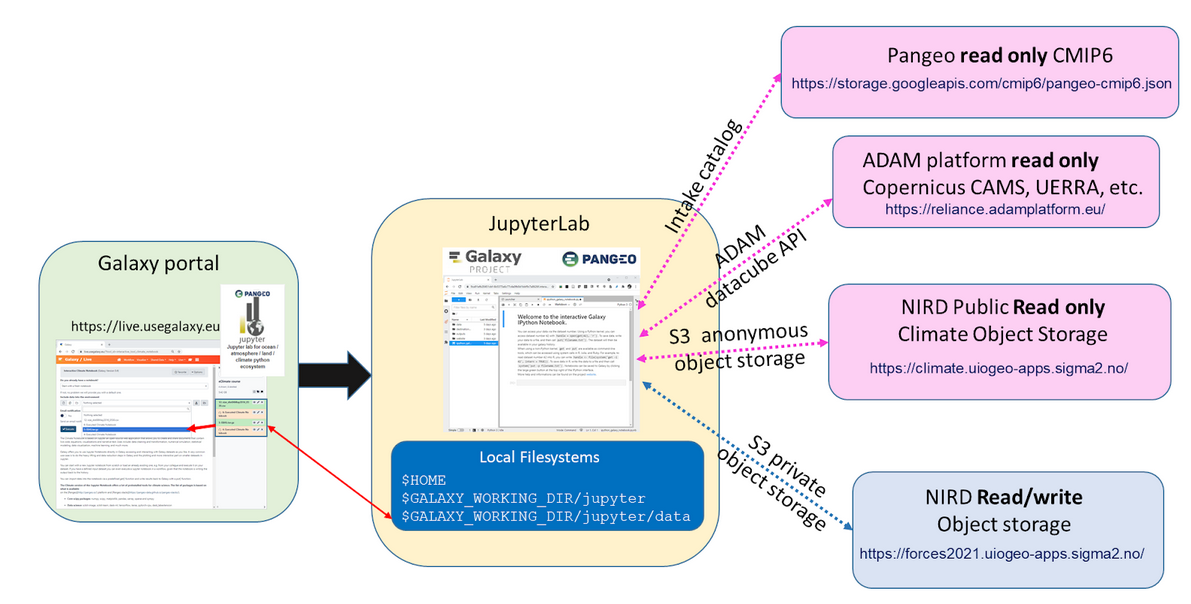 Figure 1: different storage endpoints available to Galaxy Pangeo Climate JupyterLab during the EScience 2021 course.
The setup is very flexible:
- New data can be added (NIRD Read/Write) during the course to accommodate new needs.
- New software, packages & conda Jupyter environment can be added by any users.
- The notebooks are regularly saved in the NIRD Read/Write object storage and/or in GitHub.
Group work
We had 28 participants to the course, mostly master students and PhDs, divided in 7 groups and mentored by PhDs and/or postdocs:
- Group 1 - SOA: SOA stands for Secondary Organic Aerosols and this group works on the evaluation of SOA mediated earth System feedbacks.
- Group 2 - LOBSTER: The LOBSTER group works on Linking Ocean, Biosphere and Sea ice in ArcTic modEls and obseRvations (LOBSTER).
- Group 3 - OCTOPUS: The OCTOPUS groups work on explOring aerosol-Cloud inTeractiOns in CMIP6 models Using joint-hiStograms (OCTOPUS).
- Group 4 - GENIUS: The GENIUS groups work on GeoENgineering Impacts on the occUrrence of extreme eventS (GENIUS).
- Group 5 - ACRTLVE: The ACRTLVE group works on Atmospheric Circulation Response To Large Volcanic Eruptions (ACRTLVE).
- Group 6 - BLAZING!: The BLAZING! group works on Biomass burning cLimate responses in the America ZImbabwe-area and Northern reGions (BLAZING!).
- Group 7 - AT: The AT group works on Aerosol Trends (AT).
Each group works on different scientific questions and may use different datasets. This makes this course very challenging from a technical point of view as we need to offer access to large amounts of data (satellite and in-situ observations, climate model outputs such as CMIP6, copernicus reanalysis, etc.).
Course outcome & preliminary results
Using the Pangeo ecosystem was quite new for many attendees and challenging when it comes to manipulate large amounts of satellite observations or climate models. Xarray and dask concepts were not always well understood and we under-estimate the need to explain basic principles of Pangeo. It is not straightforward to understand all the subtleties of Xarray and dask, and student’s sessions have crashed a number of times! Next course, we will put more emphasis on the basics and will try to explain the concepts behind xarray and dask at the very beginning of the course. On the other hand, the flexibility of the Galaxy Pangeo Climate JupyterLab allowed students to start immediately and to try out new packages (they can be installed in the current conda environment or a new conda environment can be created). Below, you will find a short overview of the work done by each group with some examples of their work.
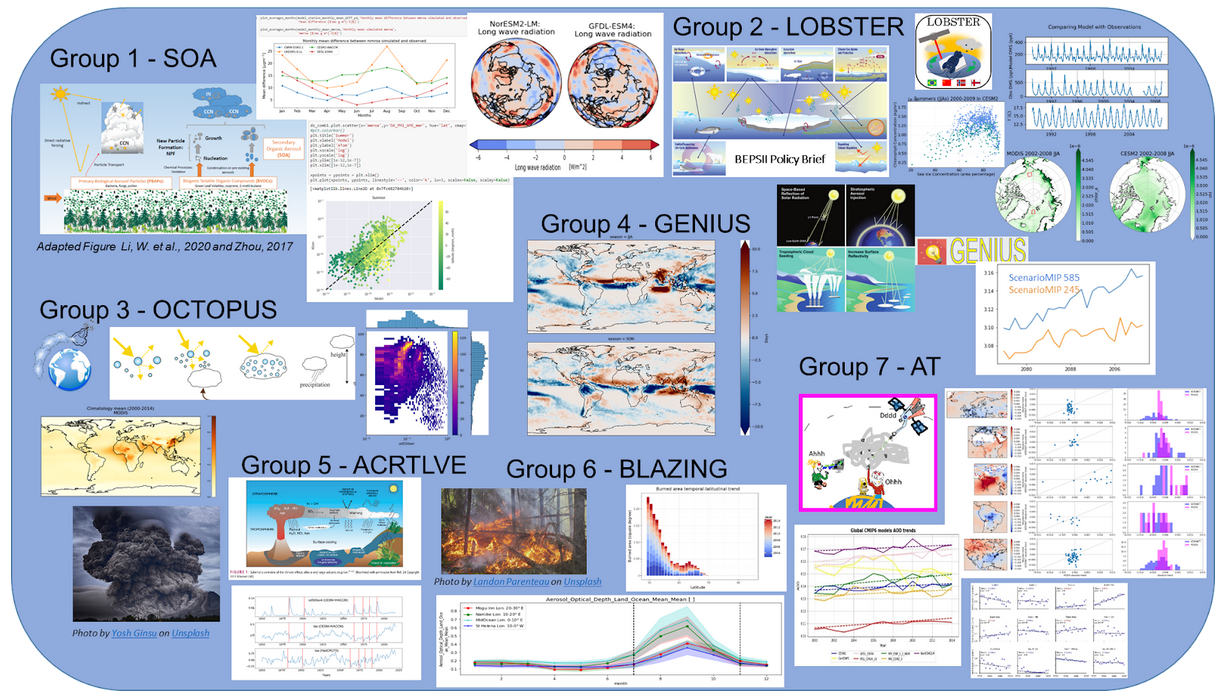 Figure 2: Overview of the work done by all the groups during the eScience2021 course.
What’s next?
The course is still not finished e.g. all the students are working on their final Jupyter notebook, report and oral presentation. We have already identified new topics/tutorials to develop for Galaxy training e.g.:
- The pangeo ecosystem and its optimal usage
- Introduction to aerosols and Climate
- Cloud microphysical processes For each topic, we could have slides for the “theory” and hands-on to illustrate and check learner understanding.
In addition to Galaxy training, we plan to wrap some of the “tools/work” (jupyter notebooks) to create new Galaxy tools and facilitate the complex usage of xarray and dask.
Supported by